Case study Smart mobility
SALKA
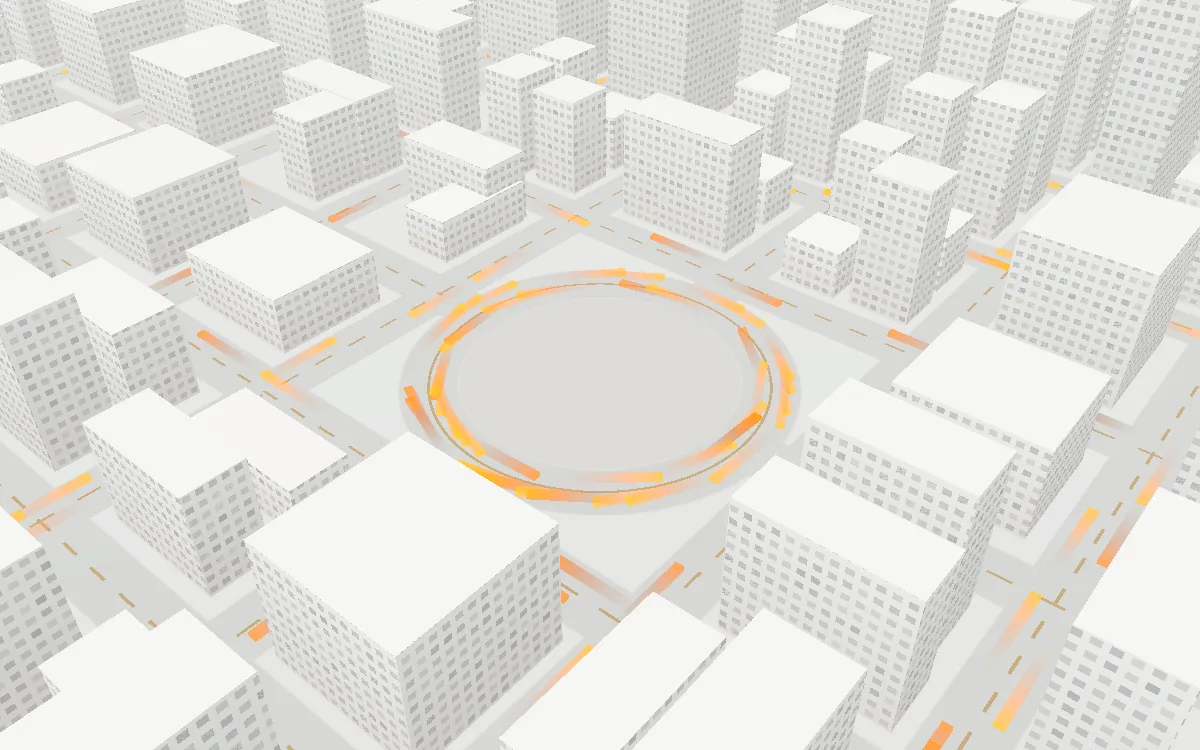
An adaptive traffic control and smart mobility framework for Irbid, tested on a digital twin of Culture Circle.
- Self-initiated
- Team SYNTRA
- My role: system design & research

15%
Up to 15% lower average vehicle waiting time, measured in the SUMO simulation.

The problem
Traffic congestion is one of the biggest urban challenges in Jordan. Vehicle ownership keeps growing, public transport is underused, and most signals still run on fixed schedules.
- Traffic lights follow fixed timers regardless of real demand.
- Congestion at one major intersection cascades into the roads around it.
- Emergency vehicles lose time at congested junctions.
- Navigation apps can spot congestion, but they cannot change how the infrastructure behaves.
The approach
SALKA works at the infrastructure level, not just the route level. It has two goals:
Intelligent traffic management
Analyse conditions at major intersections and adjust signal timing to cut queues and waiting times.
Smart mobility services
Give citizens route suggestions, arrival estimates, bus tracking and traffic alerts.
System architecture
Three layers, from raw data to the people who use it.
Layer 3
User layer
A citizen app for routes, bus tracking, arrival times and alerts. A dashboard for operators with live monitoring, congestion heatmaps, signal status and analytics.
Layer 2
Intelligence & processing
Traffic analysis of density, queues and waiting times. Adaptive signal control for priority, green duration and phase changes. Route optimization and data fusion into one view of the network.
Layer 1
Data collection
Intersection cameras, vehicle counts and queue lengths. Bus GPS and schedules. SUMO simulation output. Ambulance priority requests.
Why Culture Circle
The pilot area in Irbid concentrates the problems found across Jordanian cities: high traffic density, several intersecting flows, heavy public transport activity, peak-hour congestion and strategic importance in the city.
Building the prototype in SUMO
- Digital twin. The Culture Circle road network was extracted from OpenStreetMap, imported into SUMO, and its signals and intersections configured.
- Traffic generation. Realistic scenarios with private cars, public buses, peak hours and congestion events.
- Traffic analysis. Python and TraCI collect vehicle counts, queue lengths, waiting times and occupancy while the simulation runs.
- Adaptive control. Green phases stretch for congested approaches, waiting drops, and emergency vehicles get priority.
Try the idea
Same traffic, two controllers. The timer switches every 20 seconds. SALKA follows the queues and clears the way for ambulances.
In this model: Measuring… across 0 cars.
An illustrative model running in your browser. The real result, up to 15% less waiting, comes from the SUMO simulation of Culture Circle.
What gets measured
Traffic
Average travel time, average waiting time, queue length, throughput.
Environment
Fuel consumption and CO2 emissions.
Public transport
Route efficiency and bus travel time reliability.
Emergency response
Delay reduction for emergency vehicles.
What makes it different
Adaptive signal control
Lights respond to real-time conditions instead of fixed schedules.
Public transport integration
Bus locations feed into traffic management and route decisions.
Emergency priority
Ambulances and emergency vehicles get signal priority to cut response times.
Digital twin first
Every change is tested on a virtual copy of the network before the real one.
One platform
Traffic management and citizen mobility services live in a single framework, not separate apps.
Built to scale
The same architecture extends from Culture Circle to more intersections, cities and networks.
Expected impact
- Less congestion around Culture Circle and more efficient signal timing.
- Average waiting time down by up to 15%, the figure reached in simulation.
- More visible and reliable public transport.
- Faster movement for emergency vehicles.
- Lower fuel consumption and emissions.
- A foundation for future smart mobility work in Jordan.
Who it is designed for
Authorities
Transport ministries and municipalities, such as Greater Irbid Municipality.
Operators
Public bus operators, future BRT operators and ride-hailing services.
Citizens
Daily commuters, students, employees and visitors.
How we worked
An Agile process in five phases.
- Requirements and planning. Problem analysis, stakeholders and the system architecture.
- System design. Data flows, the dashboard and the simulation plan.
- Development. SUMO integration, the control algorithm and the dashboard.
- Testing. Functional tests, simulation validation and KPI evaluation.
- Evaluation. Performance analysis, final presentation and a roadmap for scaling.